Flexibilidade nas Conexões
O DrDash se adapta à maturidade de dados da sua empresa. Trabalhamos com três origens principais.
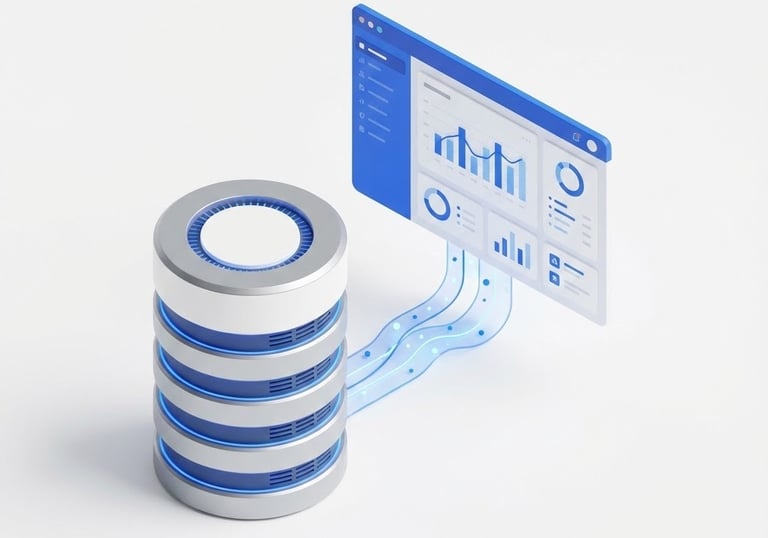
Conexão com Banco de Dados
Conectamos diretamente ao seu MySQL, PostgreSQL ou SQL Server. Ideal para operações robustas que precisam de dados em tempo real sem intervenção manual.
Leitura segura (Read-only)
Atualização programada

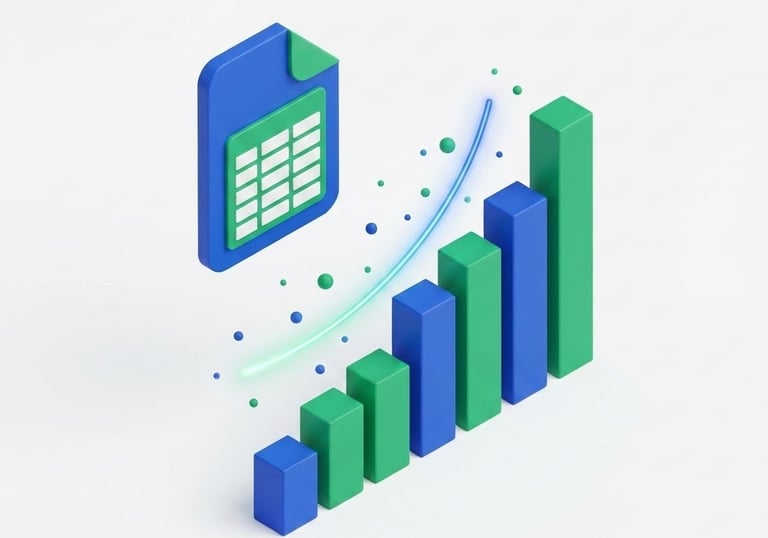
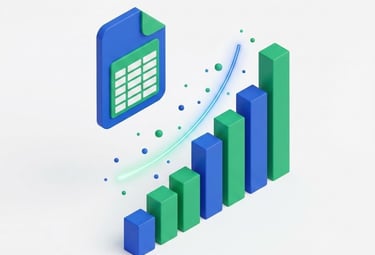
Planilhas Excel e CSV
Sua empresa ainda roda em planilhas? Sem problemas. O DrDash oferece um importador simples e rápido para transformar tabelas estáticas em dashboards dinâmicos.
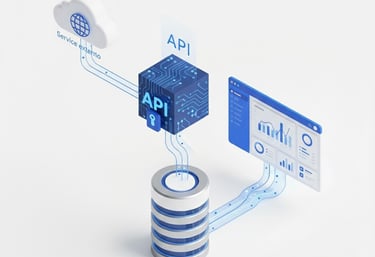
Precisa integrar com um ERP específico ou CRM proprietário? Desenvolvemos integrações sob medida via API.
API & Projetos Especiais
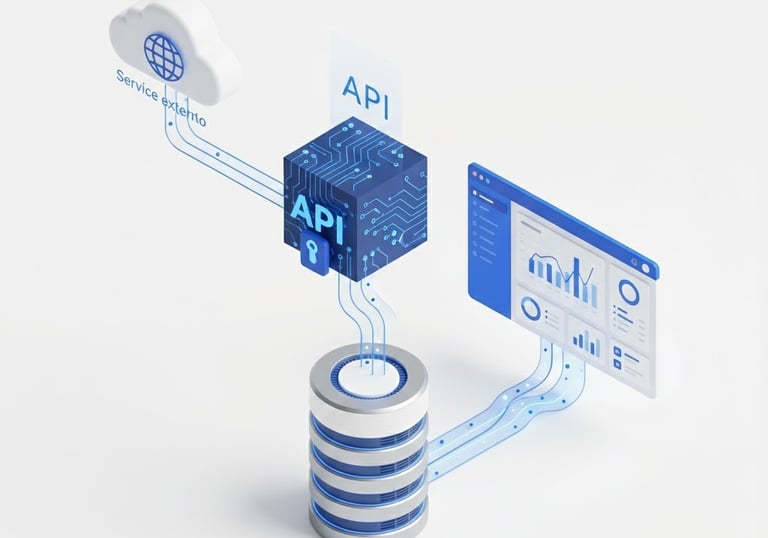
Serviço Premium
Explore suas opções
A drdash transformou nossos dados em insights visuais incríveis, facilitando a tomada de decisões. Recomendo a todos que buscam inteligência de negócios!
João Silva

★★★★★
DrDash
Transformamos dados em insights visuais e claros.
PRODUTO
© 2026. All rights reserved.
KMR Solutions Servicos de Tecnologia LTDA
EMPRESA
LEGAL